
David Wells
My research focuses on using bioinformatics to improve healthcare, with a particular emphasis on infectious disease. At EIT Pathogena I am a senior bioinformatician working on pandemic preparedness and implementing a global pathogen surveillance system. My aims are to improve individual patient care by providing clinicians with the insights from whole genome sequencing; then, provide double benefit from this data by informing public health policy with global pathogen surveillance.
Click for more details of my work...
I co-founded the Quantitative Omics Research group with Dr Michael McAuley. This group aims to bring new mathematical insights to biological data and develop tools to make these analyses accessible.
Previously I worked to prevent infectious diseases through vaccine design and viral genomics at Vaccitech (now Barinthus). During this time I worked on a large number of diseases such as MERS, EBV and its associated cancers, and several autoimmune diseases. Here I developed several tools to aid vaccine design such as HLAfreq and epitope_aligner.
During my research at DIOSVax I worked to develop broadly protective antigens, originally focused on a universal flu vaccine but rapidly focusing on SARS-CoV-2 at the beginning of the pandemic. This project went on to receive $42 million from CEPI. During the pandemic I also partnered with the Royal Papworth hospital as part of the Humoral Immune Correlates of COVID-19 consortium. This project received £1.5 million and one of my roles was managing the results from a battery of separate assays we were performing on all in coming samples.
I use this blog to share interesting results that are too small for a paper, and for demonstrations to get people started with applying some of these techniques to their own data. If you would like to contact me please get in touch through linkedIn.
Posts

HLA as predictors of disease
Estimating Disease Rates Without Diagnosis.
By any means
The impact of different averages on rankings.
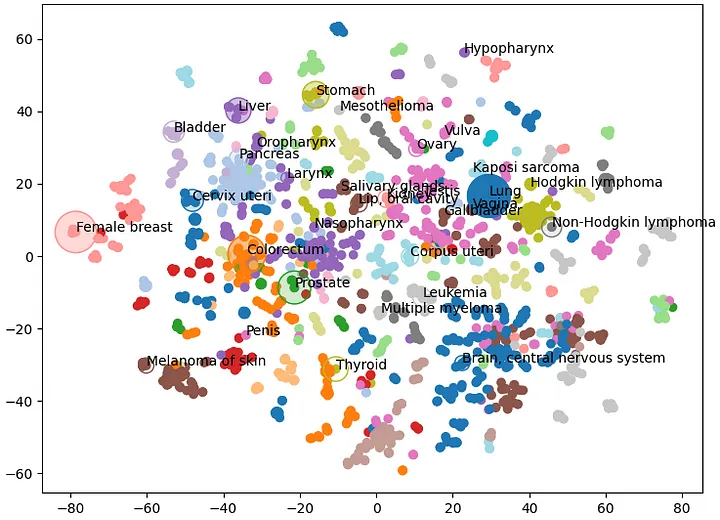
Exploring cancer types with neo4j
How to identify and visualise clusters in knowledge graphs.

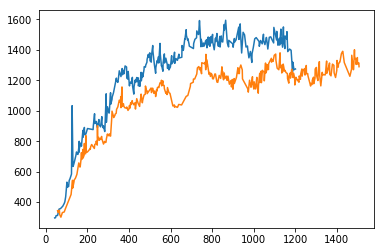
Codon pair optimisation
Optimising genes with a genetic algorithm.

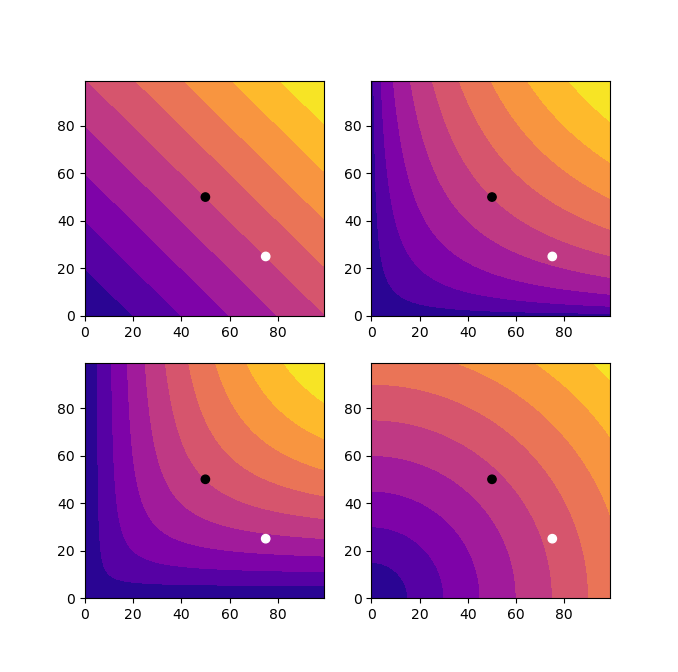
Matplotlib cmap
Simple demos of matplotlib's cmaps.
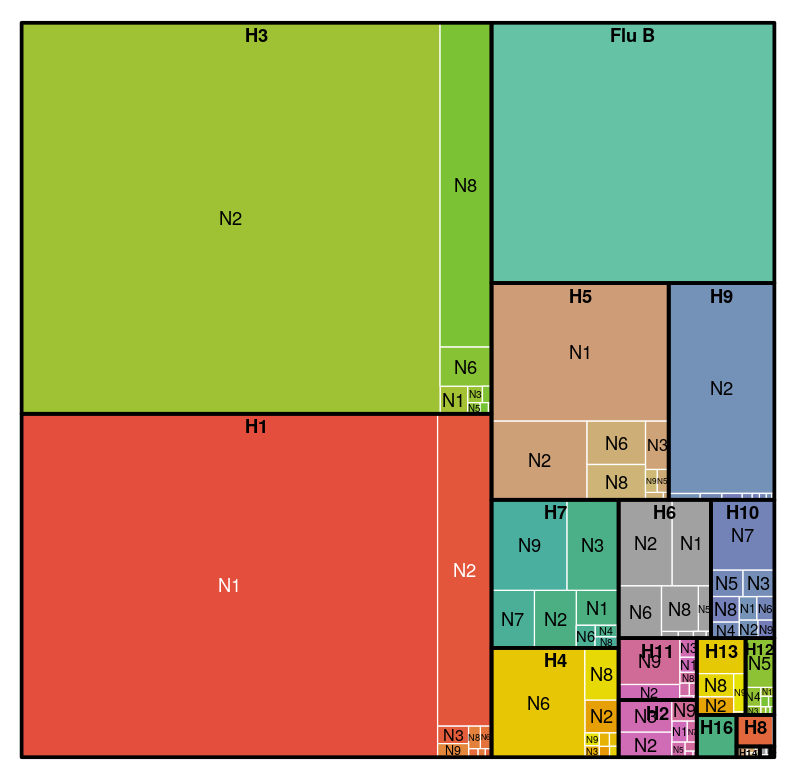
Flu subtypes
How is the flu sequence data distributed across subtypes, hosts and countries on the NCBI data base?
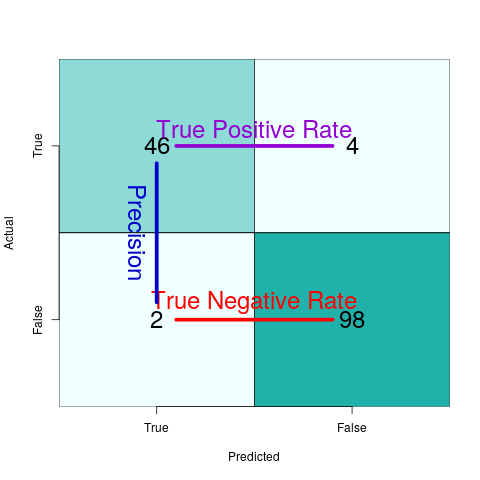
Confusion matrix
When reporting binary classification models, just looking at accuracy doesn't give the full picture. You need sensitivity & specificity, or precision & recall.
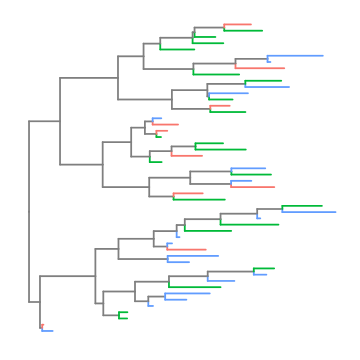
ggtree samples
Code snippets for various ggtree examples.
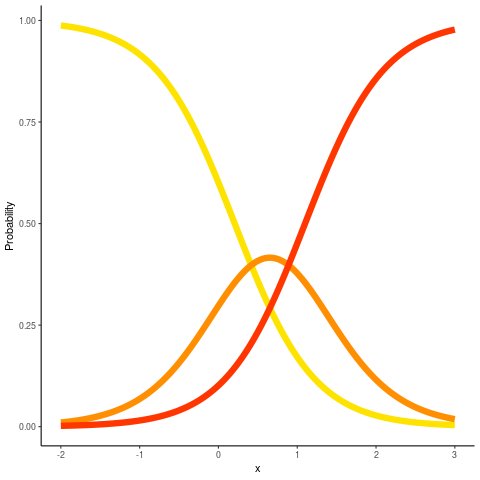
Ordinal GLM
When a response variable is ordered categories you can predict all categories using a single proportional odds model, instead of separate logistic regression models.
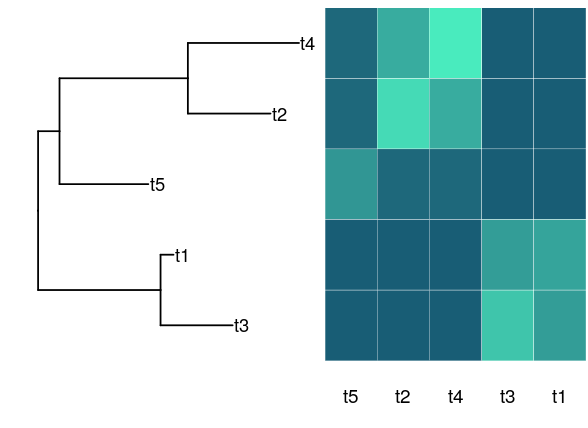
Phylogenetic mixed modelling
Simulate data for a phylogenetic mixed model using a phylogenetic tree to impose the phylogenetic covariance structure.
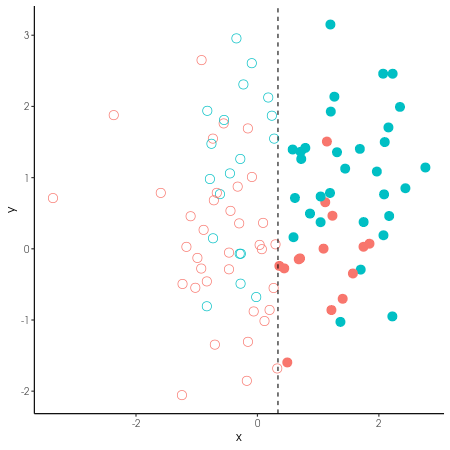
Gaussian mixture
Unsuperivsed classification based on bivariate data using a gaussian mixture model.
Power & resolution
When binning a continuous variable, e.g. into high and low, positive and negative, you lose information and statistical power.

Additive mixed modelling
Fitting an additive mixed model to account for both long an short term effects of time while fitting an autocorrelation structure to the residuals.
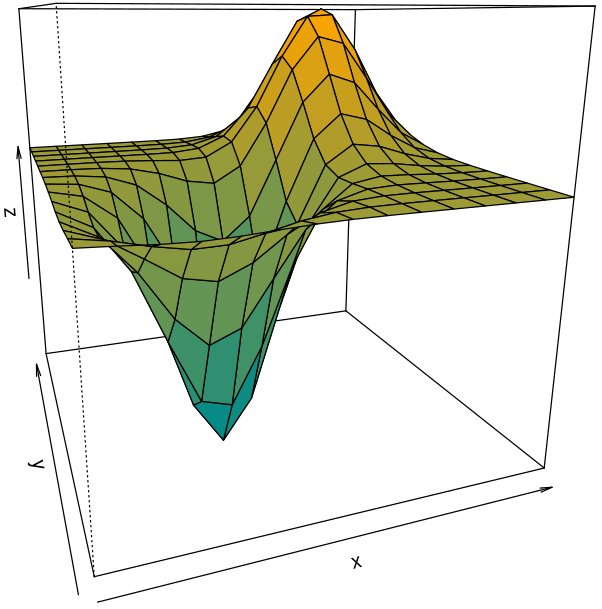
Gaussian process
Fitting a gaussian process to time series data. Using this approach domain knowledge can be used to choose an appropriate covariance function.

Graphic Cite
Web scraping, analysing, and interactive visualisations of data on scientific publishing.

The Denatured
A pop science outreach website produced by a small team of writers and vloggers which I organise.
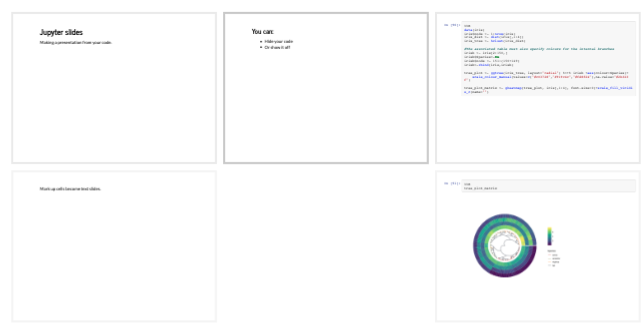
Jupyter Slides
Easily turn your code, workflow, and results into a presentation. This is great for sharing results with or without your code.